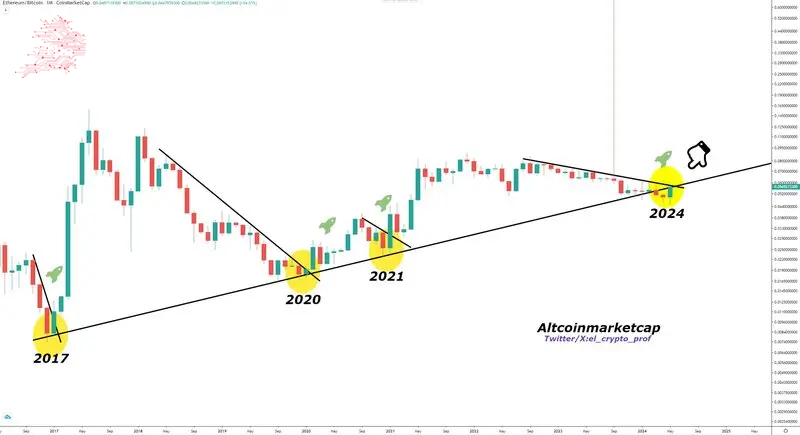
ETH/BTC Bounces From A 7-Year Support Trend Line: Ethereum To $4,900?
After a crucial week for Ethereum, a technical candlestick arrangement shows that ETH prices could prepare for a sharp upturn in the coming weeks and months.
Pointing out events in the monthly chart, one analyst notes that the ETH/BTC ratio reverses from a multi-year support trend line. Usually, the analyst continued, when prices bounce from this line, altcoin prices tend to react, trending higher.

ETH/BTC Rising From Crucial Support Trend Line
The ETH/BTC is a ratio closely monitored by technical analysts. It compares the performance of the world’s first and second most valuable coins.
Although Bitcoin has been firm for the better part of the last two years, the monthly chart clearly shows a descending channel, indicating an upward trend.
So far, there have been a series of higher lows. This suggests that bulls have been soaking in selling pressure over the years, keeping prices higher.
Looking at the monthly chart, this month’s bar will close firmly as bullish. This will result in a double-bar bullish reversal pattern that may ignite demand.
This will subsequently help pump ETH prices even higher. Even so, the relatively lower trading volume, lower than those seen in July 2022, suggests that participation is not at historically high levels.
A bullish bar in June confirming this month’s gain could be the base of another leg up. If this happens, it will mirror those of January 2021. Another 40% gain versus Bitcoin could see ETH close above 0.08 BTC, propelling the coin closely toward 2017 highs.

Overall, Bitcoin has been firm. From September 2022, BTC has been outperforming ETH, erasing gains from 2020 and 2021. The result was a descending channel, though this phase of lower lows also had relatively low participation levels.
Technically, based on a volume Analysis, this is bullish for ETH. Even so, a close above 0.08 BTC would be a strong testament from the bulls. It could potentially set a foundation to cement ETH, further narrowing BTC’s dominance.
Spot Ethereum ETFs To Drive Demand: Path To $4,900?
Over the years since launching and the final approval of spot Bitcoin exchange-traded funds (ETFs) in January, the digital asset was the only one recognized by the United States Securities and Exchange Commission (SEC).
Because of this advantage, the approval of the derivative product has seen BTC become an institution’s go-to asset. Wall Street players like Fidelity and BlackRock have been enabling exposure to BTC via spot ETFs over the past four months, resulting in billions being poured into the asset.
However, this changed last week when the United States SEC approved listing all spot Ethereum ETFs. ETH staking was removed from amended 19b-4 files.
Still, the fact that Ethereum is almost being clarified represents a massive boost for the network and the platform. ETH prices shot by as much as 30% in response, outperforming Bitcoin.
It is highly likely that ETH prices will continue rising in the coming weeks. Though it remains to be seen how the reception will be, especially among investors, the coin, like BTC prices post mid-January 2024, will rally, perhaps breaking $4,100 and even all-time highs of 2021.


Comments
Post a Comment