What’s next for Bitcoin as it forms ‘super bullish pattern’?
Although the cryptocurrency market has hit a rough spot following the news of Changpeng Zhao stepping down as Binance CEO as part of the $4.3 billion settlement with the United States Securities and Exchange Commission (SEC), Bitcoin (BTC) has been demonstrating bullish signs.
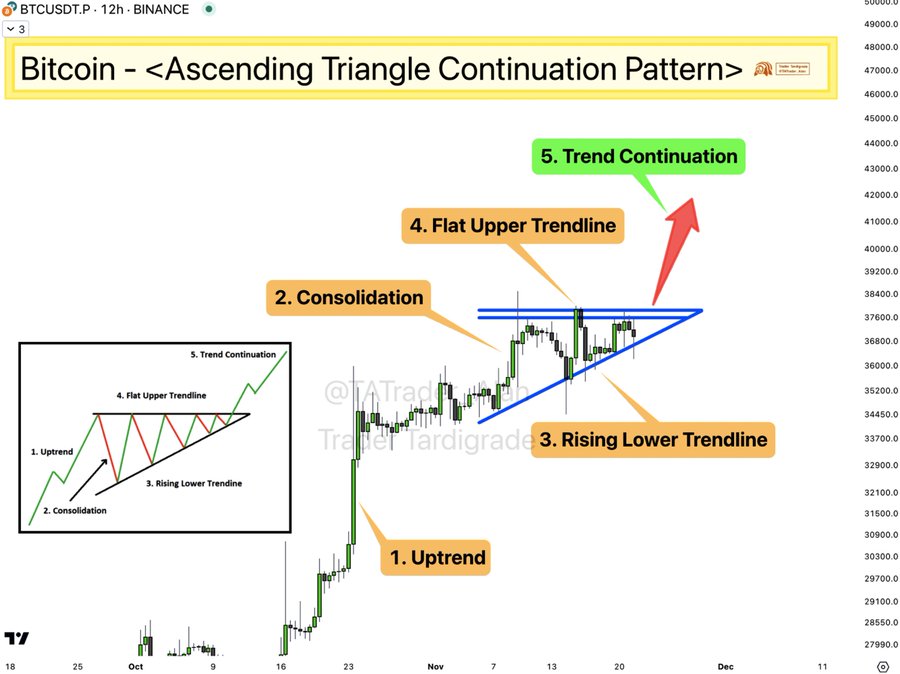
Specifically, the renowned pseudonymous cryptocurrency specialist Trader Tardigrade observed that Bitcoin had formed “a super bullish pattern” on the 12-hour chart, which he said was an ascending triangle continuation chart pattern in an X post published on November 21.
As the cryptocurrency analyst further explained, this chart pattern was “happening in an uptrend, forming a consolidation with a rising lower trendline and a flat upper trendline,” and Bitcoin should “continue the uptrend after breaking out of the flat upper trendline.”
More positive signs
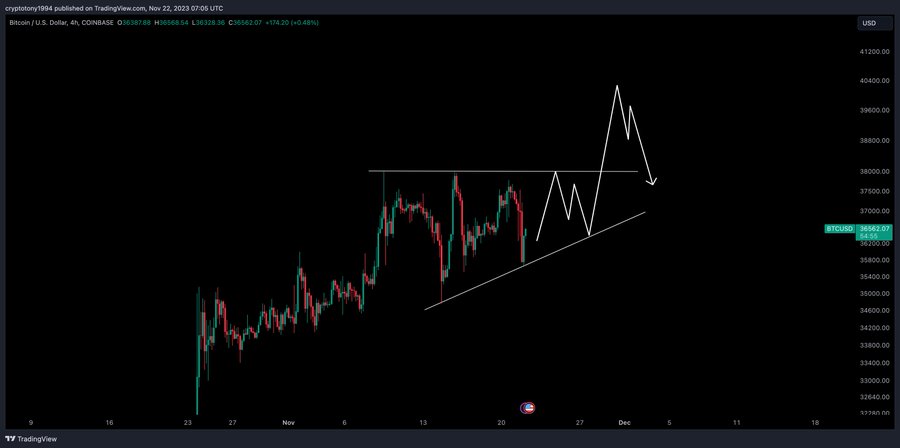
At the same time, a colleague crypto trading expert, Crypto Tony, has noted that the maiden crypto asset was demonstrating “higher highs and higher lows,” adding it was “hard to be bearish right now,” in a chart analysis he shared in an X post on November 22.

Mt. Gox to distribute $5.67 billion to rehabilitation creditors ‘shortly’

Could Bitcoin reach $220,000 within the next halving?

Abu Dhabi-based Bitcoin miner Phoenix Group raises $370 million in IPO

Cardano gears up for a massive move to this price

Solana falls 6% in a day; Huge crash to $30 incoming?
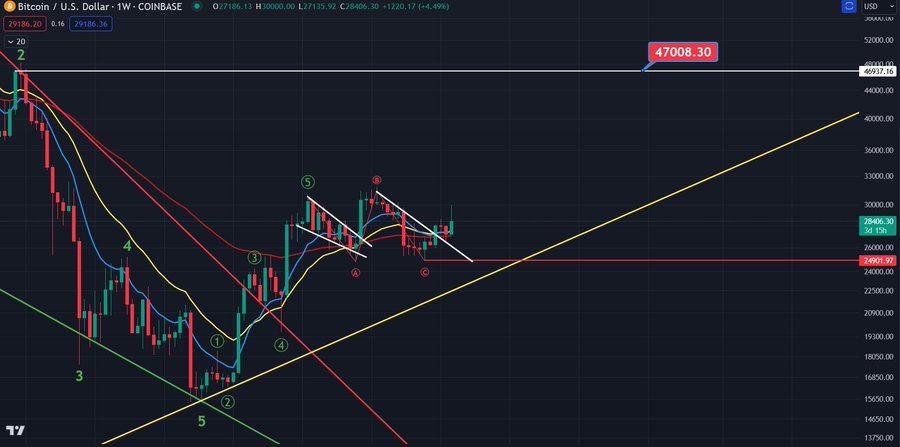
Furthermore, another crypto analyst, CoinsKid, highlighted that Bitcoin was either “gearing up for the next leg up” or “all of this FUD campaign [is] about to see it fall off the edge of a cliff here,” reposting his analysis from October 19, when he observed that the asset might be marching towards $47,000.
It is also worth noting that the renowned Bitcoin analyst Willy Woo stated that this digital asset dropping under $30,000 was no longer an option, considering that historically its price never came back to retest this band of support any time when it had “strong bands of the agreed price, coming out of a bear market, and leading into the next halvening (marked in vertical bands).”

Bitcoin price analysis
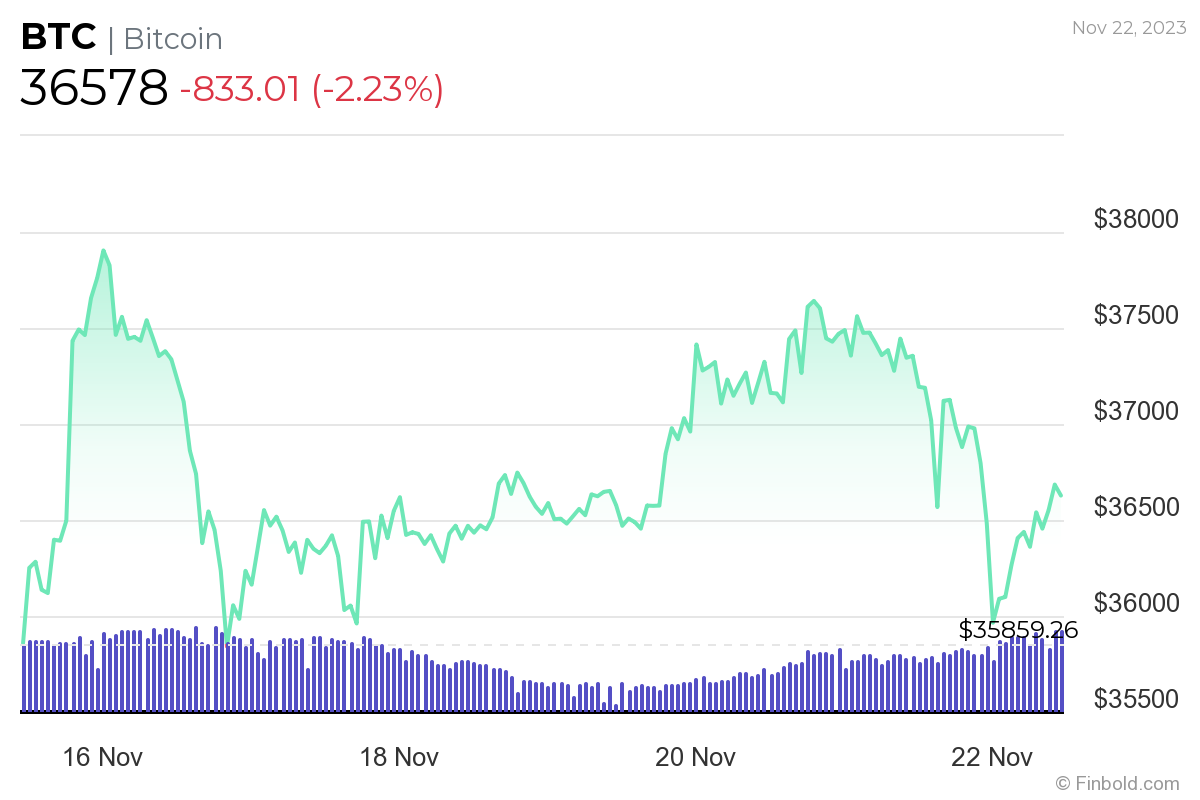
Meanwhile, Bitcoin was at press time trading at $36,578, indicating a decline of 2.23% on the day but still holding onto the 2.18% gain across the previous week and a more significant increase of 20.07% over the past month, according to the most recent information on November 22.
Indeed, the flagship decentralized finance (DeFi) asset might still come out on top, especially taking into account the expectation of approval of a spot Bitcoin exchange-traded fund (ETF) and the upcoming halving event that some predict could herald Bitcoin price at $220,000, as Finbold reported on November 21.
Disclaimer: The content on this site should not be considered investment advice. Investing is speculative. When investing, your capital is at risk.


Comments
Post a Comment